Support and Resistance: Essential Tools for Traders
Key Takeaways:
- Key Levels: Support and resistance mark critical price levels where price may reverse or continue, helping define entry and exit points.
- Role Reversal: When breached, support and resistance levels often switch roles, signaling shifts in market psychology.
- Practice Makes Perfect: Use platforms like BullRush to practice identifying these levels and improve trading strategies with minimal risk.
Understanding Support and Resistance in Technical Analysis
Support and resistance are basic notions in technical analysis, important to traders and analysts as ways of understanding market behavior and seeking perfect entry and exit. Such levels are important because they identify where price is likely to stop, go backward, or continue as per the forces of supply and demand. Mastering support and resistance levels will generally make trading strategies a little more accurate, although subjectively interpreted and requiring a little practice.
What is Support and Resistance Level?
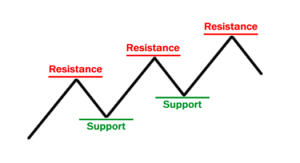
Support and resistance levels are some crucial price levels in a chart where the market participants both buyers and sellers, are most active. They reflect the balance of supply and demand forces that drive the price action, hence determining whether the market will continue in its current direction or reverse.

Support is the level of price at which demand, or buyers, is strong enough to absorb the available supply and prevent further decline. As the price lowers towards the support level, buyers become more willing to buy, so demand outstrips supply, halting the downward movement and often starting a reversal or a pause in the downtrend.
Resistance is the level of price at which supply is strong enough to delay, if not prevent, further price advancement. As the prices reach a resistance level, it becomes increasingly likely that sellers will be willing to sell and buyers may decide to wait, thus halting or reversing the upward price movement.
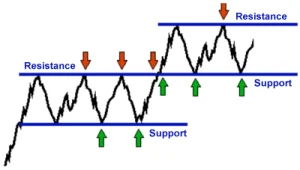
When these levels are broken, they often reverse roles: support becomes resistance, and resistance becomes support, indicating that the psychology of the market has changed.
Psychology Behind Support and Resistance
The psychology of support and resistance is what makes it, in essence, so essential to understanding market behavior. Here’s an example for better understanding of the process: Support: Assume a stock is trading near a support level at $50. Some buyers who have purchased the stock previously at $50 may be waiting for the price to pull back into this level to buy more. Furthermore, those traders who have missed the initial move up and feel sorry for not having bought the stock at $50, decide that if it is tested again, they will buy at that price. This way, demand gets concentrated at that price level, and the support is reinforced.
Resistance: Conversely, when a stock approaches a resistance level-say, $55-maybe there are some traders who purchased the stock at lower prices and are looking to sell at $55. Consequently, there are more sellers at that level, whereas buyers are reluctant to enter a market that has such a high price, which then may cause a reversal or a pause in the uptrend.
This market psychology is self-reinforcing. Due to this, traders do similar things when the price is at one of these major levels; hence, resistance and support are very important when performing technical analysis.
Change of Polarities: Role Reversal
Once a resistance or support is penetrated, a role reversal might occur; that is, a resistance level, for instance, may become a support level. On the other hand, if the price breaks above a resistance level, it often becomes a new support level. This phenomenon, called role reversal, occurs when the underlying forces of supply and demand have changed, and the price is expected to flow in the direction of the break.

Charting Support and Resistance
Traders and analysts plot various tools to identify levels of support and resistance on charts. Some of these include:
- Trendlines: Drawing by connecting higher highs and lows, or lower highs and lows on the price chart defines it. In an uptrend, the trend line defines support, while during a downtrend, the level of resistance is considered to be provided by the same.
- Moving Averages: MA is normally used in deciding dynamic support and resistance. As the prices head over or beneath the MA, it might resist the motion.
- Round Numbers: Round price levels (e.g., $50, $100) tend to be psychological support or resistance. Many traders set orders at these levels, which reinforce their importance.
Range Trading: Buying at Support and Selling at Resistance
Support and resistance levels provide traders with essential entry and exit points. The general strategy is:
- Buying at Support: Traders may look to enter a long position when prices reach a support level, anticipating that demand will push the price back up.
- Selling at Resistance: Traders may look to sell or short a stock when it reaches resistance, anticipating that supply will prevent further price increases.
When a price breaks through support or resistance, traders may use that as an indication of a trend reversal or continuation, depending on the direction of the break.
Example: Range-Bound Trading
- Scenario: Bitcoin has been fluctuating between $90,000(support) and $99,000(resistance) for several weeks. The price repeatedly drops to $28,000 and bounces back up.
- What it means: Traders see this as a range, where the price tends to reverse direction at the support and resistance levels. Bitcoin is moving between these levels, so traders buy near $90,000 and sell near $99,000.
- Actionable Insight: Range traders place buy orders near $90,000 and sell orders near $99,000. They might also place tight stop-loss orders below $90,000 to protect themselves in case the price breaks the support level.
Using Support and Resistance in a Trading Plan
Incorporating support and resistance into a trading plan involves:
- Identifying Key Levels: Start by identifying significant support and resistance levels on the chart using trendlines, historical price action, and other indicators.
- Setting Entry and Exit Points: Based on these levels, traders can set buy orders near support and sell orders near resistance. Stops and targets can also be placed slightly below support or above resistance to account for minor fluctuations.
- Monitoring Breakouts: When a price breaks through a key support or resistance level, traders can use the breakout as a signal to enter trades in the direction of the breakout.
Practice Support and Resistance with BullRush
If you’re looking to improve your trading skills, especially in applying concepts like support and resistance, BullRush offers a fantastic trading platform for practice. BullRush is a gamified trading simulator that lets you practice real-time trading with virtual funds, minimizing the financial risk while maximizing the opportunity to refine your strategies.
Whether you’re a beginner looking to get a grasp on charting or an experienced trader aiming to perfect your techniques, BullRush provides a low-pressure, interactive environment to practice identifying support and resistance levels. Participate in real-time trading challenges and trading competitions, test different trading strategies, and learn from others, all while having fun.
https://www.youtube.com/watch?v=SvIWx7BjRS0


